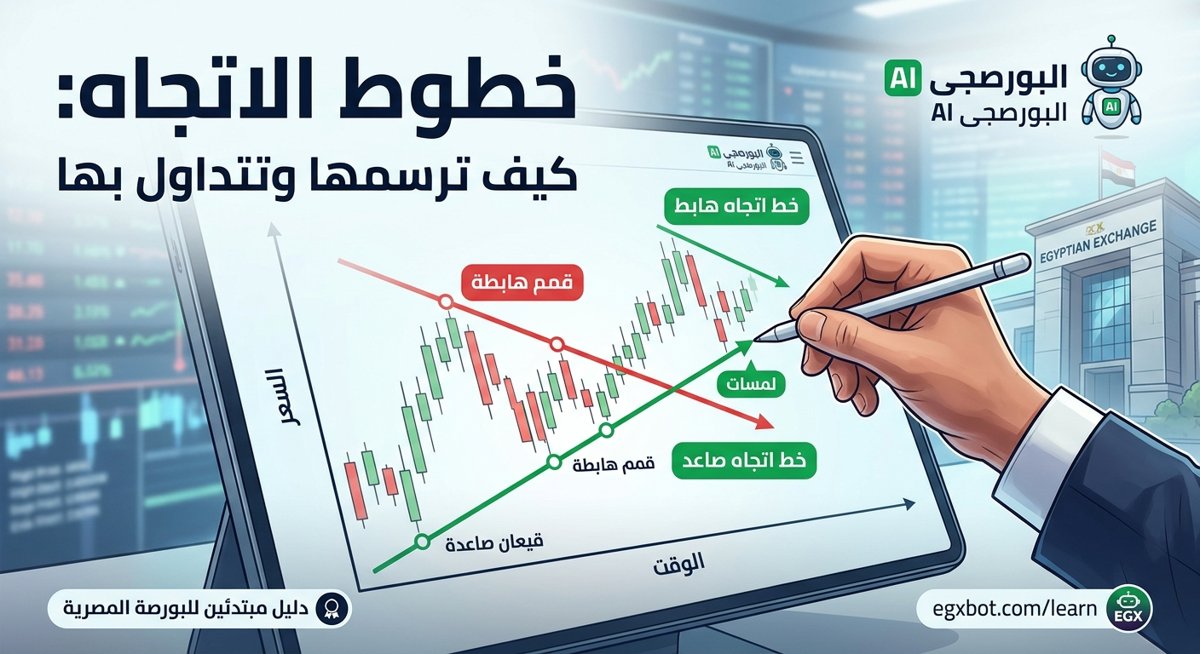
Trendlines are simple technical analysis tools that connect price peaks or troughs to determine market direction. They help traders in the Egyptian stock market identify support and resistance levels and make trading decisions. To draw them, you need at least two price points and extend the line forward.
Introduction
In the world of the Egyptian Stock Exchange (EGX), understanding market trends is one of the most important skills for a beginner trader. Trendlines are a simple yet powerful tool that helps you determine the overall direction of a stock, whether up, down, or sideways. In this educational article, we will learn how to draw trendlines and use them in daily trading on stocks like COMI and HRHO.
What Are Trendlines?
A trendline is a straight line connecting two or more price points on a chart. An uptrend line is drawn by connecting successive higher lows, while a downtrend line connects successive lower highs. The line acts as a dynamic support or resistance level where price may bounce.
Why Trendlines Matter in the Egyptian Stock Market?
The EGX often exhibits clear technical patterns. Using trendlines, traders can identify optimal entry and exit points. For example, COMI showed a strong uptrend in 2023, and trendlines were useful in identifying buying opportunities when price approached the line.
How to Apply Trendlines Step by Step?
- Choose the timeframe: Beginners prefer the daily chart.
- Identify peaks and troughs: Look for two clear highs or lows.
- Draw the line: In an uptrend, draw a line connecting two rising lows. In a downtrend, connect two falling highs.
- Verify validity: The more touches on the line, the stronger it is.
- Use the line: In an uptrend, buy near the line; if broken, consider selling.
Example from EGX: HRHO Stock
Consider HRHO on the daily chart. From January to March 2024, the stock formed two higher lows at EGP 2.50 and EGP 2.80. Draw a line connecting them. When price retested the line at EGP 3.20 in April, it was a good buying opportunity. The stock later rose to EGP 4.00.
Common Mistakes Beginners Make
- Drawing arbitrary lines without clear points.
- Using points too far apart in time.
- Ignoring line tests (multiple touches).
- Not updating the line after a break.
Advanced Tips for Traders
- Combine trendlines with other indicators like support/resistance or moving averages.
- Watch for trendline breaks with high volume to confirm reversal.
- In strong trends, use multiple trendlines (price channel).
Summary
Trendlines are essential tools for every EGX trader. Learning to draw them correctly improves your decisions. Start applying them on stocks like COMI and HRHO, and remember that practice is key to mastery.
Frequently asked questions
What is the minimum number of points to draw a valid trendline?
At least two points, but three points are preferred to confirm validity.
How do I know a trendline has been broken correctly?
A break with a candle closing beyond the line and increased volume gives a strong signal.
Can trendlines be used on shorter timeframes?
Yes, but they are less reliable. Daily or weekly charts are recommended for beginners.
What is the difference between an uptrend and downtrend line?
An uptrend line connects rising lows and acts as support, while a downtrend line connects falling highs and acts as resistance.
Do trendlines apply to all stocks on the EGX?
Yes, but some stocks may be erratic, so it's important to verify the line's validity.
How do I use trendlines with other indicators on the EGX?
You can combine them with moving averages or RSI to confirm signals.
Apply it with egxbot
Get real-time analysis, signals and a bilingual AI assistant for Egyptian Exchange stocks — free to start.
Start free on Telegram