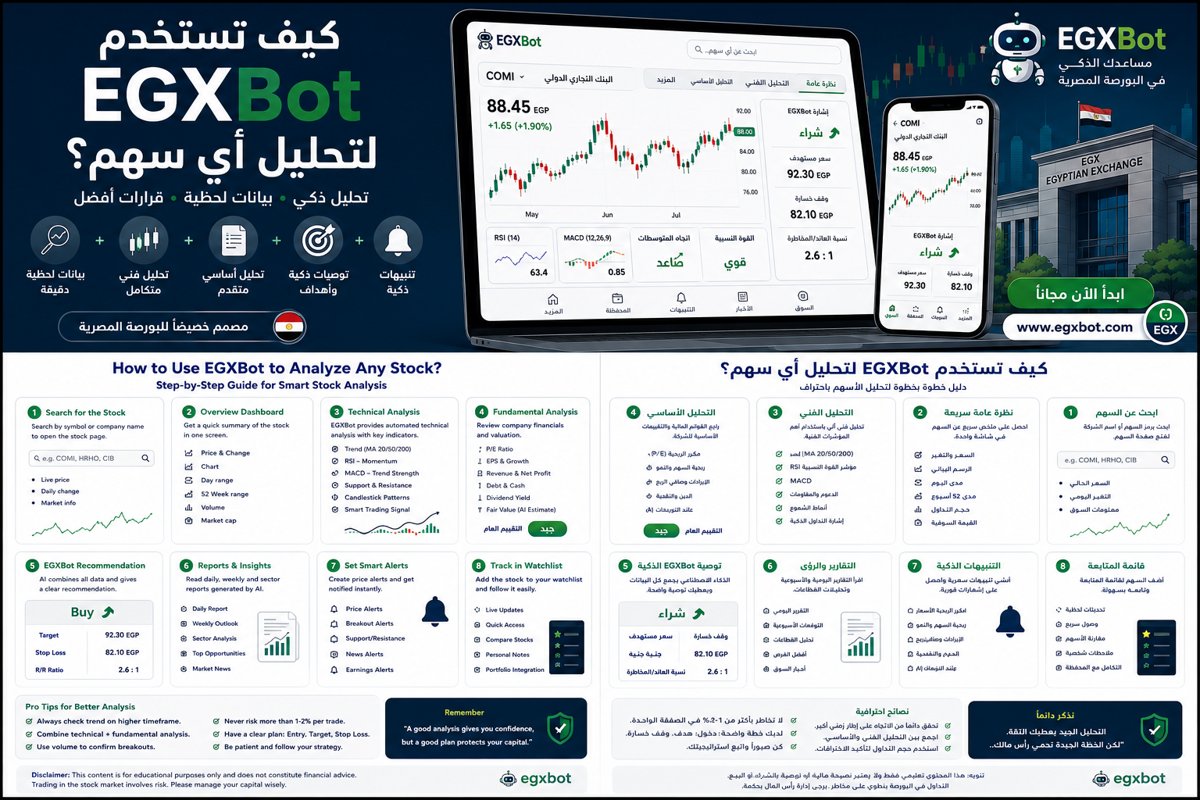
To use EGXBot for stock analysis, enter the stock symbol or name in the bot or smart assistant, then review the trend, support and resistance, indicators, liquidity, targets, and stop-loss. Next, open the live chart to confirm the setup, then create price alerts near entry, target, or stop-loss levels before making a decision.
Stock analysis is not only about looking at the current price. Traders need to understand trend, support and resistance, momentum, trading volume, upside and downside scenarios, stop-loss, and targets. EGXBot helps organize these elements into a clearer analytical view.
This guide explains how to use EGXBot to analyze any stock on the Egyptian Exchange step by step, whether you use the Telegram bot, the live terminal, or the smart assistant. The goal is not to make automatic decisions without thinking, but to use the analysis as a map for more informed decisions.
What Is EGXBot?
EGXBot is an AI-powered stock and portfolio analysis platform focused on the Egyptian Exchange. It helps traders review technical analysis, indicators, support and resistance, alerts, and portfolio insights.
The core idea is to turn large amounts of market data into a practical summary: what is happening in the stock, what levels matter, where the risk is, and what scenarios may develop.
Before You Start: What Do You Need?
- The stock symbol or company name, such as COMI, TMGH, or FWRY.
- A clear objective: short-term trading, daily monitoring, or medium/long-term investing.
- The amount of capital allocated to the trade.
- A willingness to define stop-loss before entry.
- An understanding that analysis must be combined with risk management.
EGXBot helps you read the data, but it does not remove your responsibility to review the plan and manage risk before buying or selling.
Step One: Enter the Stock Symbol or Name
Start by opening the bot or smart assistant and entering the stock symbol you want to analyze. If you do not know the symbol, use the company name in Arabic or English when available.
Examples of useful prompts:
- Analyze COMI.
- What do you think about TMGH today?
- Give me a technical analysis of FWRY.
- What are the main support and resistance levels for SWDY?
- Is EAST in an uptrend?
The clearer the question, the more useful the answer. Instead of asking “Is the stock good?”, ask for trend, support, resistance, target, and stop-loss.
Step Two: Read the Trend Summary
The first part to review is the trend. Is the stock rising, falling, or moving sideways? Trend defines the type of opportunity to look for.
| Stock Condition | Meaning | How to Handle It |
|---|---|---|
| Uptrend | Higher highs and higher lows, or price above key averages | Look for pullback buys or confirmed breakouts |
| Downtrend | Lower highs and lower lows, or broken support levels | Avoid random buying and wait for structural improvement |
| Sideways range | Price moves between support and resistance | Watch support bounces or confirmed resistance breaks |
Do not focus on the target first. Understanding trend prevents buying a weak stock only because it has fallen or selling a strong stock because of a normal pullback.
Step Three: Review Support and Resistance
Support and resistance are key decision levels. Support is an area where demand may appear, while resistance is an area where supply or selling pressure may appear.
- Nearest support level.
- Nearest resistance level.
- Whether price is closer to support or resistance.
- Whether the stock has broken important support.
- Whether the stock has closed above resistance.
How to Use These Levels
If price is close to strong support and a rebound signal appears, risk may be lower because the stop can be placed nearby. If price is very close to strong resistance, buying may be late unless a clear breakout occurs.
Step Four: Understand Technical Indicators
EGXBot may show indicators such as RSI, MACD, moving averages, and trading volume. These indicators do not make decisions alone, but they help confirm price behavior.
| Indicator | What It Shows | How to Use It |
|---|---|---|
| RSI | Momentum and relative strength | Use it to confirm momentum or identify divergence |
| MACD | Momentum and trend shifts | Watch crossovers with price structure, not alone |
| Moving averages | General trend and dynamic support/resistance | Use them as trend filters |
| Volume | Strength of participation | A high-volume breakout is stronger than a weak breakout |
For example, if the analysis says the stock broke resistance, check whether volume supports the breakout, whether RSI is improving, and whether price is above an important moving average.
Step Five: Use Advanced Analysis Methods
EGXBot combines several analytical approaches, including Smart Money Concepts, Elliott Waves, Gann cycles, chart patterns, and fair-value analysis when relevant.
Smart Money Concepts
This framework helps monitor liquidity zones, order blocks, liquidity sweeps, and changes in market structure. It can help explain why price moves toward certain levels before reversing or breaking out.
Elliott Waves
Elliott Wave analysis helps identify where a stock may be within a broader upward or downward cycle. It should not be used alone, but it can add context when combined with trend, support, and resistance.
Gann: Time and Price
Gann-style analysis focuses on the relationship between time and price. It may help identify important price or timing areas, but always requires confirmation from price and volume.
Fair Value and Fundamentals
For investors, fair value, earnings growth, debt, and sector conditions matter. A technically attractive stock may not be suitable for investment if fundamentals are weak or valuation is excessive.
Step Six: Read Scenarios, Not Just Targets
Good analysis should not only provide a target. It should describe scenarios:
- If price holds above resistance, the next target becomes more relevant.
- If price fails to break out, it may return to support.
- If price breaks the stop-loss level, the setup weakens.
- If volume expands with the rally, the bullish scenario becomes stronger.
Treat the analysis as a conditional map. Do not enter only because you saw a target; enter when the required scenario conditions are present.
Step Seven: Define Entry, Target, and Stop-Loss
After reading the analysis, convert it into a simple plan. It is not enough to say “the stock is good.” You need to know where to enter and where to exit.
| Element | Question | Example |
|---|---|---|
| Entry | What level makes buying logical? | After breaking EGP 20 or rebounding from EGP 18.50 |
| Stop-loss | Where is the idea invalidated? | Below EGP 18.20 |
| Target | Where can profit be taken? | At EGP 21.50 or EGP 22 |
| Position size | How many shares can be bought without exceeding risk? | Based on capital and stop distance |
Step Eight: Use the Live Terminal to Confirm the Reading
After receiving the analysis summary, open the live chart to review price action yourself. Watch candlesticks, volume, trend, and price location relative to support and resistance.
The live terminal helps with:
- Monitoring price during the session.
- Viewing charts and indicators in real time.
- Following the market, sectors, and active stocks.
- Checking whether the stock is near an important level.
- Avoiding late entry after the move has already happened.
Step Nine: Create a Price Alert
Instead of watching the screen all day, use alerts to monitor important levels. You can set alerts near entry, resistance, support, target, or stop-loss.
- Alert me if the stock breaks EGP 20.
- Alert me if the stock returns to EGP 18.50 support.
- Alert me if the stock reaches the EGP 22 target.
- Alert me if the stock breaks the EGP 18.20 stop-loss.
Alerts help you trade with a plan instead of reacting emotionally during the session.
Step Ten: Ask the Smart Assistant for Details
If you do not understand part of the analysis, ask the smart assistant for clarification. You can request a simpler explanation, compare two stocks, or ask why a signal appeared.
- Explain why the analysis is positive for this stock.
- What is the most important level to watch today?
- Is the risk acceptable if I enter from this price?
- Compare COMI and TMGH by trend and momentum.
- What bearish scenario invalidates the buy idea?
Practical Example: Analyzing a Stock Step by Step
Assume you want to analyze a hypothetical stock trading at EGP 19.80. EGXBot shows that the short-term trend is improving, nearby resistance is EGP 20, and support is EGP 18.70.
- The stock is close to resistance, so buying before breakout may carry more risk.
- If it closes above EGP 20 with strong volume, the breakout becomes more meaningful.
- If it fails to break out, price may return to support around EGP 18.70.
- The stop-loss can be placed below the nearest support or invalidation level.
- The first target can be set near the next resistance level shown by the analysis.
If entry occurs after breakout at EGP 20.10 and stop-loss is EGP 19.20, the risk is EGP 0.90 per share. If the target is EGP 21.90, potential reward is EGP 1.80, producing a 2:1 reward-to-risk ratio.
This example is educational and does not represent a recommendation to buy or sell any security.
Using EGXBot for Portfolio Analysis
If you own several stocks, analyzing each one separately is not enough. You need to view the portfolio as a whole: are you concentrated in one sector? Do all your stocks move with the same index? Does every position have a stop-loss and plan?
- Understand capital allocation between stocks.
- Identify higher-risk positions inside the portfolio.
- Review diversification across sectors.
- Track performance, targets, and stop-loss levels.
- Build a daily or weekly monitoring plan.
When to Act and When to Wait
Not every analysis means you should enter immediately. Sometimes the best decision is to wait until price reaches a better level.
| Situation | Better Action |
|---|---|
| Price is near strong support | Watch for rebound and volume confirmation |
| Price is directly under resistance | Wait for breakout or retest |
| Price breaks out with strong volume | Evaluate entry or wait for retest |
| Price breaks important support | Avoid buying until a clear reclaim appears |
| Risk is larger than reward | Skip the trade or wait for a better price |
Common Mistakes When Using EGXBot
- Reading only the target: stop-loss and scenarios matter too.
- Entering without checking the chart: analysis is useful, but price confirmation is still important.
- Ignoring volume: weak breakouts can fail quickly.
- Using all capital on one signal: position size and risk must be calculated.
- Treating analysis as a profit guarantee: any analysis can be wrong.
- Not using alerts: alerts help prevent chasing price too late.
- Ignoring portfolio risk: several trades may depend on the same sector or direction.
Decision Checklist
- Did I enter the correct stock symbol?
- Do I understand the overall trend?
- Do I know the nearest support and resistance?
- Did I review RSI, MACD, and volume?
- Do I understand the bullish and bearish scenarios?
- Have I defined a clear entry?
- Have I defined stop-loss?
- Is reward-to-risk acceptable?
- Did I open the chart to confirm?
- Did I create a price alert instead of watching randomly?
Frequently Asked Questions
Does EGXBot give direct buy or sell recommendations?
EGXBot provides analysis, data interpretation, and possible scenarios. The final decision should depend on your own plan and risk management. No analysis should be treated as a profit guarantee.
Can I analyze any Egyptian stock?
You can use the stock symbol or company name to request analysis for stocks available on the platform. Decision quality improves when you combine analysis, charts, liquidity, and official news.
What is the best prompt to write to the smart assistant?
Use a specific prompt such as: “Analyze COMI technically and define support, resistance, target, and stop-loss.” Specific questions usually produce clearer answers.
Is EGXBot only for short-term trading?
It can be used for daily monitoring and trading, but also for portfolio review and investment follow-up through technical analysis, fundamental context, alerts, and performance tracking.
Should I open the chart after reading the analysis?
Yes. The chart helps you see the current price location, candle behavior, volume, and whether the opportunity is still valid or price has already moved too far.
Conclusion
Using EGXBot effectively starts with a clear question, followed by an organized review of trend, support, resistance, indicators, liquidity, and scenarios. Then convert the analysis into a plan: entry, target, stop-loss, and position size.
The real value is not only receiving a target price, but understanding why the stock matters, what confirms the scenario, and which level invalidates the idea. Use the bot, smart assistant, live terminal, and alerts as tools for more disciplined decisions.
Stock trading and investing involve financial risk. This content is educational and does not constitute a direct recommendation to buy or sell any security.
Start Analyzing Your First Stock with EGXBot
Enter the stock symbol, review trend, support, resistance, and indicators, then use the live terminal and alerts to build a clear entry and exit plan.
This content is educational and does not constitute a direct recommendation to buy or sell. Use analysis with proper risk management and never risk money you cannot afford to lose.
Apply it with egxbot
Get real-time analysis, signals and a bilingual AI assistant for Egyptian Exchange stocks — free to start.
Start free on Telegram