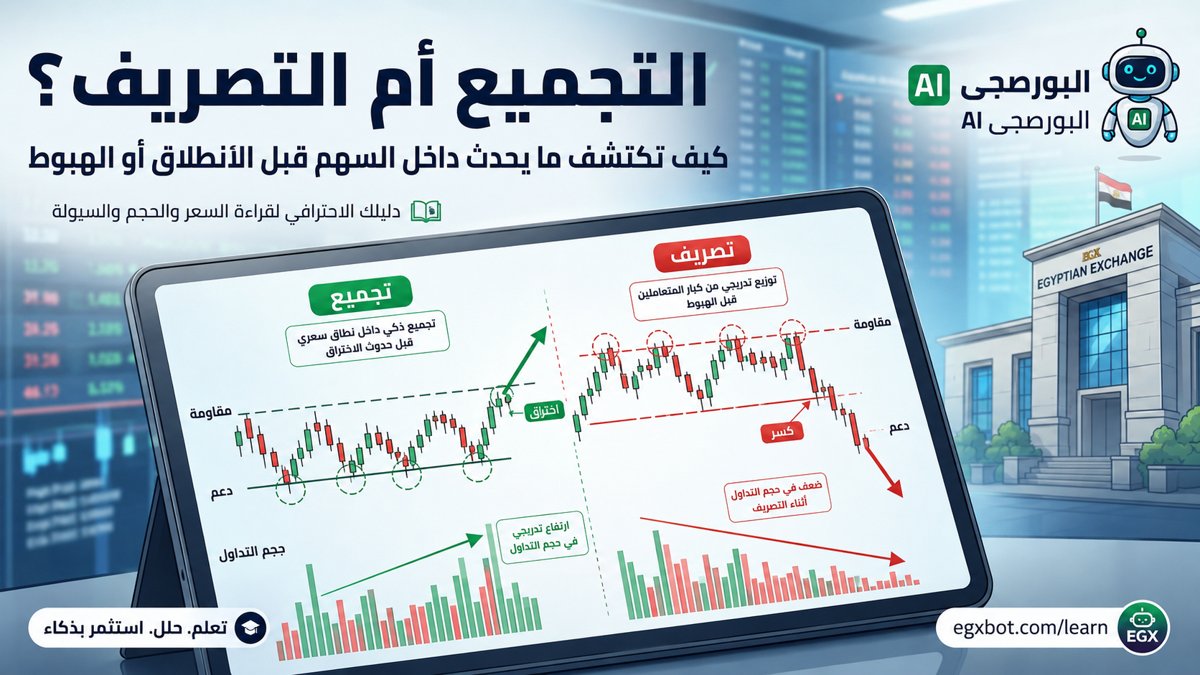
Accumulation or distribution cannot be identified reliably from a single indicator or large visible orders. Genuine accumulation often shows selling absorption, repeated successful support tests, declining supply, improving volume-based indicators and finally a breakout confirmed by strong volume. Distribution often shows repeated failure near resistance, false breakouts, weakening highs, rising volume on declines and deterioration in indicators such as OBV, CMF and A/D. The strongest analysis combines price action, volume, relative volume, structure and liquidity rather than relying on one signal.
One of the most important questions in technical analysis is whether a sideways stock is undergoing accumulation before an advance or distribution before a decline.
The two processes can look remarkably similar on a basic chart. The difference becomes clearer only when price structure is combined with volume, liquidity, relative strength and money-flow behavior.
What Is Accumulation?
Accumulation is a process in which selling supply is gradually absorbed by willing buyers while price develops a new area of balance.
It does not prove that one specific institution or “market maker” is buying. The more accurate interpretation is that demand is increasingly absorbing available supply.
What Is Distribution?
Distribution is the opposite process. Price may remain strong near a high while new buying demand allows existing holders to gradually reduce exposure.
This is why distribution can initially look bullish.
Accumulation and Distribution Are Processes, Not Candles
A single candle cannot reliably identify either condition. Evidence develops over multiple tests, rallies, pullbacks and volume events.
Start With Location
A range after a major decline may represent accumulation or continuation.
A range after a major advance may represent distribution or re-accumulation.
Context narrows the possibilities but does not determine the answer.
Price and Volume Must Be Read Together
| Price Behavior | Volume | Possible Interpretation |
|---|---|---|
| Support test holds | High | Possible selling absorption |
| Repeated support tests | Declining | Supply may be drying up |
| Rally from support | Increasing | Demand strengthening |
| Resistance breakout | Strong | Better accumulation confirmation |
| High-volume rally near resistance | Very high but little progress | Possible distribution |
| Resistance breakout quickly fails | High | Potential Upthrust |
Absorption
Absorption occurs when substantial market pressure produces surprisingly little price movement.
If heavy selling reaches support but price refuses to break meaningfully, buyers may be absorbing the available supply.
Typical signs include:
- Repeated support tests.
- Lower rejection wicks.
- High volume with limited downside progress.
- Fast recovery after weakness.
- Failure to create meaningful new lows.
Wyckoff Accumulation
Phase A
The existing decline begins losing control. Preliminary Support, Selling Climax, Automatic Rally and Secondary Test may appear.
Selling Climax
Heavy selling and volatility appear after a decline. The critical information comes afterward: does the market stabilize and stop making lower lows?
Secondary Test
Price revisits the lower area to test whether significant supply remains. Lower volume and reduced downside progress can be constructive.
Phase B
The market builds a trading range as supply and demand are repeatedly tested.
Spring
A Spring temporarily breaks support and then quickly returns into the range.
A better-quality Spring usually includes:
- A temporary break.
- Rapid reclaim.
- Reduced follow-through selling.
- A later successful test or Higher Low.
Phase D
Signs of Strength become clearer through Higher Lows, stronger rallies and weaker pullbacks.
Phase E
Price leaves the range. A resistance breakout with above-average volume and successful acceptance above the breakout provides stronger confirmation.
Re-Accumulation
Re-accumulation occurs when an existing uptrend pauses in a range before attempting to continue higher.
Re-Accumulation vs Distribution
Ask:
- Is support being defended?
- Does downside volume contract?
- Are rallies stronger than declines?
- Is relative strength still positive?
- Is OBV stable or improving?
- Are breakout failures becoming frequent?
Wyckoff Distribution
Buying Climax
Aggressive buying appears after a strong advance, but high volume fails to create proportionate price progress.
Upthrust
Price briefly moves above resistance and then falls back into the range.
UTAD
An Upthrust After Distribution is a late false breakout that occurs after much of the distribution process has already developed.
Important confirmation includes:
- Failure to hold the breakout.
- Return into the range.
- Increasing supply.
- Later internal support failure.
Sign of Weakness
Support breaks as downside spread and selling volume expand.
Last Point of Supply
Price retests former support from below and fails, potentially creating a lower-risk exit or bearish continuation area.
Re-Distribution
Re-distribution occurs when a downtrend pauses inside a range before continuing lower.
A range after a decline should therefore never automatically be labeled accumulation.
Important Indicators
Volume
Compare volume during rallies and declines and against recent averages.
Relative Volume
RVOL = Current Volume ÷ Average Volume
A breakout with RVOL above 1.5 or 2 may carry more information than a low-volume breakout, depending on the stock and market context.
OBV
Bullish OBV divergence may appear when volume flow strengthens before price breaks higher. Bearish divergence can warn that new price highs lack volume confirmation.
Accumulation/Distribution Line
Use its trend and divergences rather than treating its name as an automatic signal.
Chaikin Money Flow
Persistent positive CMF can support an accumulation thesis, while sustained deterioration can support a distribution thesis.
MFI
The Money Flow Index combines price and volume and can help identify momentum and divergence in money flow.
VWAP
Particularly useful intraday when price repeatedly reclaims or rejects the volume-weighted average price.
Volume Profile
Volume Profile shows where trading volume occurred across price levels. High Volume Nodes and the Point of Control can help identify important acceptance zones.
RSI Divergence
Bullish divergence around accumulation lows or bearish divergence near distribution highs can provide supporting evidence, but should not be used alone.
MACD
Changes in momentum and divergence may provide additional confirmation inside the broader structure.
Volume Spread Analysis
VSA studies volume, candle spread and closing location.
Stopping Volume
Heavy selling volume with limited downside progress and a strong close can suggest absorption.
No Supply
A narrow down bar on low volume after strength may indicate reduced selling pressure.
No Demand
A narrow up bar on low volume during weakness may indicate lack of buying interest.
Effort vs Result
Volume represents effort while price movement represents result.
Large selling volume with little downside movement can suggest absorption. Large buying volume with little upside progress near resistance can warn of distribution.
Accumulation vs a Dead Illiquid Stock
A sideways stock is not automatically being accumulated.
Dead Stock Characteristics
- Persistently low volume.
- Low transaction count.
- Wide spreads.
- No meaningful liquidity improvement.
- No relative strength.
Potential Accumulation
- Gradually improving liquidity.
- Unusual volume events.
- Repeated absorption.
- Clearer support.
- Improving internal structure.
Hidden Distribution During an Uptrend
Watch for:
- New highs becoming increasingly difficult.
- Higher volume but weaker price progress.
- Repeated upper wicks.
- Failed breakouts.
- OBV failing to confirm highs.
- Deteriorating CMF.
- Increasing relative weakness.
Practical Accumulation Example
Assume a stock declines from EGP 15 to EGP 10 and trades between EGP 9.80 support and EGP 10.80 resistance for six weeks.
- Support is tested four times.
- Downside volume declines on each test.
- OBV creates a Higher Low.
- CMF gradually improves.
- Price briefly breaks EGP 9.80 to EGP 9.60 and quickly reclaims support.
- A Higher Low forms near EGP 10.05.
- EGP 10.80 breaks on 2.4x average volume.
The thesis now combines structure, absorption, declining supply, improving money flow and breakout confirmation.
Practical Distribution Example
Assume a stock rallies from EGP 12 to EGP 25 and then trades between EGP 23.50 and EGP 26.
- Resistance is tested repeatedly.
- Each rally requires more volume.
- Price makes little progress.
- OBV fails to confirm new highs.
- CMF deteriorates.
- Price breaks to EGP 26.40 but closes back at EGP 25.50.
- Support at EGP 23.50 eventually breaks on strong volume.
- A retest fails.
This combines failed breakout behavior, weakening money flow and confirmed support failure.
Entry Approaches
Early Entry
Near support after a Spring or successful test. Better potential reward, but lower confirmation.
Breakout Entry
After resistance breaks on strong volume. Better confirmation but a higher entry price.
Retest Entry
After the breakout level successfully turns into support.
Professional Accumulation Score
| Signal | Score |
|---|---|
| Defended support | +1 |
| Declining downside volume | +1 |
| Improving OBV | +1 |
| Improving CMF | +1 |
| Successful Spring | +2 |
| Higher Low after Spring | +1 |
| Relative Strength | +1 |
| Breakout with strong RVOL | +2 |
| Successful Retest | +2 |
Distribution Score
| Signal | Score |
|---|---|
| Repeated resistance failure | +1 |
| High volume with weak progress | +1 |
| Bearish OBV divergence | +1 |
| Deteriorating CMF | +1 |
| Upthrust / UTAD | +2 |
| Lower High | +1 |
| Relative Weakness | +1 |
| Support breakdown on volume | +2 |
| Failed retest | +2 |
How EGXBot Can Help
- Screen stocks trading inside defined ranges.
- Compare volume against recent averages.
- Track OBV, MFI and money-flow behavior.
- Monitor support and resistance.
- Compare stock strength with sector and index.
- Create alerts around Spring lows, breakouts and retests.
- Calculate structured accumulation and distribution scores.
Useful AI Assistant Questions
- Is this stock showing accumulation or distribution and why?
- Map the current Wyckoff structure.
- Is the latest support break a Spring or a genuine breakdown?
- Is the latest breakout a genuine breakout or an Upthrust?
- Compare volume during rallies and declines.
- Does OBV confirm price?
- Do CMF and MFI support inflows?
- Is the stock stronger than its sector and index?
- What invalidates the accumulation thesis?
- Calculate an accumulation score out of 10.
- Calculate a distribution score out of 10.
Final Checklist
For accumulation, look for defended support, declining supply, absorption, improving money flow, relative strength and a volume-confirmed breakout.
For distribution, look for resistance failure, weak price progress despite high activity, Upthrust or UTAD behavior, declining money flow, relative weakness and a support breakdown.
Conclusion
Professional accumulation and distribution analysis does not come from memorizing Wyckoff diagrams or stacking indicators on a chart.
It comes from understanding the interaction between:
Price + Volume + Location + Structure + Liquidity.
In accumulation, ask whether supply is being absorbed and gradually drying up while demand strengthens.
In distribution, ask whether buying demand is being absorbed near the top while supply progressively increases.
No single Spring, OBV signal, MFI reading or volume spike is sufficient. The real edge comes from confluence.
This material is educational and does not constitute investment advice. Accumulation and distribution structures are probabilistic and require appropriate risk management.
Do Not Guess Who Is Buying — Read the Footprint in Price and Volume
Use EGXBot to monitor support, resistance, Relative Volume, OBV, MFI, CMF, breakouts and relative strength, and require multiple confirmations before labeling a stock as accumulation or distribution.
Every structure can fail. Define invalidation and stop-loss before entry and never use an accumulation thesis as an excuse to hold an uncontrolled loss.
This content is educational and does not constitute investment advice.
Apply it with egxbot
Get real-time analysis, signals and a bilingual AI assistant for Egyptian Exchange stocks — free to start.
Start free on Telegram