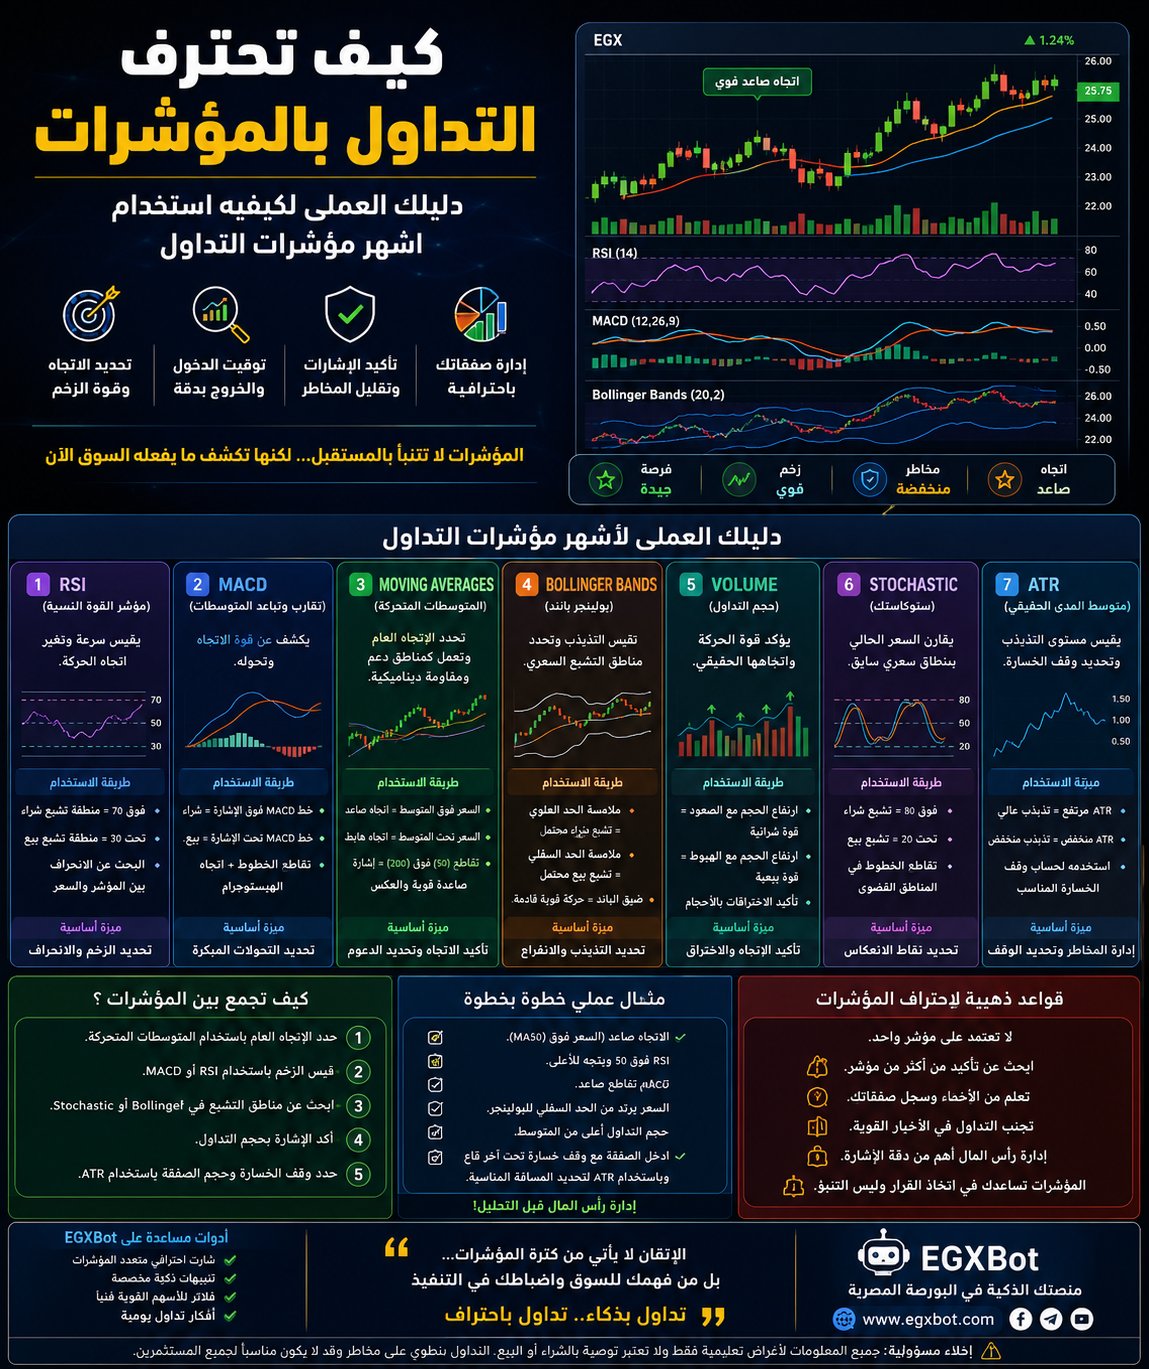
Mastering indicators does not mean placing as many as possible on a chart. A better framework uses one tool for trend, such as moving averages or ADX, one for momentum such as RSI or MACD, volume or liquidity confirmation, and a volatility tool such as ATR for risk management. Start with price structure and support/resistance, then use indicators for confirmation rather than prediction. The strongest setups combine price action, trend, momentum and volume with a defined stop-loss.
Open almost any trading platform and you will find dozens of indicators: RSI, MACD, moving averages, Bollinger Bands, Stochastic, ADX, ATR, VWAP, MFI, OBV and many more.
The common beginner mistake is assuming that more indicators automatically create better decisions.
Professional indicator use is different. The key is understanding what question each indicator answers, when it works well, when it becomes misleading and which indicators simply repeat the same information.
Indicators do not know what the market will do tomorrow. They organize what price and volume are doing now so that traders can make more structured decisions.
What Is a Technical Indicator?
A technical indicator is a mathematical calculation based on information such as price, highs, lows, closes, volume and time.
Indicators can generally be divided into four useful groups:
| Category | Main Question | Examples |
|---|---|---|
| Trend | What is the trend and how strong is it? | MA, EMA, ADX, DMI |
| Momentum | Is price momentum accelerating or weakening? | RSI, MACD, Stochastic |
| Volume / Money Flow | Is participation confirming the move? | Volume, RVOL, OBV, MFI, CMF |
| Volatility | How much is price moving? | ATR, Bollinger Bands |
Avoid Indicator Redundancy
RSI, Stochastic and Williams %R are all momentum oscillators. If all three show overbought conditions, that is not necessarily three independent confirmations.
A more balanced framework is:
Trend + Momentum + Volume + Risk.
Price Comes First
Before checking an indicator, identify:
- Trend.
- Support.
- Resistance.
- Higher highs and higher lows.
- Lower highs and lower lows.
- Trading ranges.
Indicators should confirm the price thesis rather than replace it.
Moving Averages
Moving averages are among the most useful trend tools.
SMA
A Simple Moving Average gives equal weight to prices within the calculation period.
EMA
An Exponential Moving Average gives more weight to recent prices and therefore reacts faster.
Common Periods
- EMA 9 or 10 — very short-term.
- EMA 20 — short-term trend.
- MA 50 — medium-term trend.
- MA 200 — long-term trend.
Professional Moving Average Use
- Trend filter.
- Dynamic support or resistance.
- Trend alignment.
- Avoiding trades against a dominant trend.
Crossovers such as the Golden Cross and Death Cross can be useful but often occur after a significant move has already taken place.
RSI
RSI is a momentum oscillator generally scaled between 0 and 100.
The standard setting is:
RSI(14)
- Above 70 — traditionally overbought.
- Below 30 — traditionally oversold.
Overbought does not automatically mean sell. Strong trends can keep RSI elevated for extended periods.
Better RSI Uses
- Trend range analysis.
- 50-level momentum filter.
- Bullish divergence.
- Bearish divergence.
MACD
The standard MACD setting is:
12, 26, 9
It includes:
- MACD Line.
- Signal Line.
- Histogram.
MACD is useful for trend confirmation, momentum shifts and divergence, but because it is derived from moving averages it is relatively lagging.
Stochastic Oscillator
Stochastic compares the current close with the recent price range.
- Above 80 — traditionally overbought.
- Below 20 — traditionally oversold.
It can be more useful in range-bound markets than in strong directional trends.
ADX and DMI
ADX measures trend strength rather than direction.
- Below 20 — weak or range-bound conditions.
- 20–25 — trend strength may be emerging.
- Above 25 — clearer trend environment.
- Above 40 — very strong trend.
These are guidelines rather than rigid rules.
+DI and -DI can help determine directional bias.
Bollinger Bands
The common setting is:
20-period average with 2 standard deviations.
Bollinger Squeeze
Narrow bands indicate low volatility and can precede expansion.
The bands do not predict breakout direction. Price structure and volume must provide that information.
Walking the Band
A strong trend can remain near the upper or lower band for an extended period. Touching a band is not automatically a reversal signal.
ATR
Average True Range measures volatility, not direction.
It can be used to adapt:
- Stop-loss distance.
- Position size.
- Trailing stops.
- Expected movement.
Example
ATR = EGP 0.40 and a trader uses 1.5 ATR.
Volatility distance = EGP 0.60.
The final stop should still correspond to a valid technical invalidation level.
Volume
Volume is one of the most important confirmation tools.
- Breakout + strong volume = better confirmation.
- Breakout + weak volume = greater failure risk.
- Rising price + expanding volume = stronger participation.
- Rising price + shrinking volume = caution.
Relative Volume
RVOL = Current Volume ÷ Average Volume
RVOL helps determine whether current participation is normal or exceptional for that particular stock.
OBV
On Balance Volume is particularly useful for divergence.
If price remains flat while OBV rises, participation may be improving before the breakout.
If price creates new highs while OBV does not, momentum may be weakening.
MFI
The Money Flow Index combines price and volume and can help analyze momentum, overbought/oversold conditions and divergence.
CMF
Chaikin Money Flow measures buying and selling pressure based on closing position and volume.
- Above zero — relatively positive money flow.
- Below zero — relatively negative money flow.
Persistence matters more than a single crossover.
VWAP
Volume Weighted Average Price is especially useful for intraday traders.
- Price above VWAP can indicate relative intraday strength.
- Price below VWAP can indicate weakness.
- A successful VWAP reclaim can support a bullish intraday setup.
- Repeated VWAP rejection can confirm weakness.
Volume Profile
Volume Profile displays volume by price rather than by time.
Important areas include:
- Point of Control.
- High Volume Nodes.
- Low Volume Nodes.
- Value Area.
Leading vs Lagging Indicators
A leading indicator does not actually know the future.
Oscillators may reveal momentum deterioration earlier, while tools such as moving averages and MACD generally confirm developments after price has moved.
Divergence
Bullish Divergence
Price creates a lower low while the indicator creates a higher low.
Bearish Divergence
Price creates a higher high while the indicator creates a lower high.
Divergence indicates weakening momentum, not an automatic reversal. Price confirmation is still required.
Select Indicators Based on Market Condition
Trending Market
- Moving averages.
- ADX.
- MACD.
- Volume.
Range Market
- RSI.
- Stochastic.
- Bollinger Bands.
- Support and resistance.
Breakout Environment
- RVOL.
- Volume.
- Bollinger Squeeze.
- Rising ADX.
- ATR expansion.
Trend-Following Example
- Price above MA50.
- MA50 above MA200.
- ADX above 25.
- RSI between approximately 50 and 70.
- Pullback toward EMA20 or support.
- Volume improves when price turns higher.
Breakout Strategy
- Clear resistance breaks.
- RVOL above normal.
- ADX strengthens.
- MACD supports momentum.
- RSI holds above 50 without major bearish divergence.
Bollinger Squeeze Strategy
- Very narrow bands.
- Low ATR that begins expanding.
- Low volume during compression.
- Resistance or support breakout.
- Strong RVOL on the breakout.
Mean Reversion in a Range
When ADX is low and the market is clearly ranging, RSI, Stochastic and Bollinger Bands can help identify potential movement between support and resistance.
If the range breaks and ADX rises, the mean-reversion thesis should be reconsidered.
Intraday VWAP Strategy
- Strong opening.
- Price remains above VWAP.
- Low-volume pullback.
- VWAP holds.
- Fresh volume appears as a short-term high breaks.
Build a Non-Redundant Indicator Stack
| Function | Possible Tool |
|---|---|
| Trend | MA50 / MA200 |
| Trend Strength | ADX |
| Momentum | RSI or MACD |
| Participation | Volume / RVOL |
| Money Flow | OBV, CMF or MFI |
| Volatility | ATR |
| Intraday Reference | VWAP |
Example Indicator Stacks
Day Trading: VWAP + EMA20 + RSI + RVOL + ATR.
Swing Trading: MA50 + MACD + Volume + OBV/CMF + ATR.
Breakout Trading: Support/Resistance + RVOL + ADX + ATR.
Multiple Timeframes
The same indicator can provide different readings on different timeframes.
A useful structure could be:
- Daily — broad trend.
- 60-minute — setup.
- 15-minute or 5-minute — execution.
Should Indicator Settings Be Changed?
Default settings are not sacred, but they should not be changed simply to make historical charts look better.
Test settings using:
- Trade count.
- Win rate.
- Average winner.
- Average loser.
- Profit factor.
- Expectancy.
- Maximum drawdown.
Backtesting Matters
Any indicator combination can look excellent when a trader selects only successful historical examples.
A better question is:
What happened across the last 100 valid signals?
Expectancy Over Win Rate
A strategy with a 40% win rate can outperform one with a 70% win rate if winners are much larger than losers.
The goal is positive expectancy, not simply being correct frequently.
Indicators Cannot Replace Risk Management
Every setup can fail.
Before entering, define:
- Entry.
- Invalidation.
- Stop-loss.
- Target.
- Position size.
- Maximum account risk.
Complete Example
Assume a stock trades at EGP 20 and shows:
- Price above MA50 and MA200.
- Rising MA50.
- ADX at 28.
- RSI at 58.
- MACD above the Signal Line.
- Resistance at EGP 20.50.
Price breaks EGP 20.50 with RVOL of 2.2.
ATR is EGP 0.35.
Hypothetical Plan
- Entry: EGP 20.60.
- Technical Stop: EGP 20.10.
- Risk per Share: EGP 0.50.
- Target 1: EGP 21.60.
- Target 2: EGP 22.20.
For an EGP 100,000 account risking 0.5%:
Risk Amount = EGP 500.
Position Size = 500 ÷ 0.50 = 1,000 shares.
The setup is stronger than a simple MACD crossover because trend, momentum, breakout, volume and risk all align.
Common Indicator Mistakes
- Using too many indicators.
- Using several indicators from the same category.
- Entering because of one signal.
- Assuming overbought always means sell.
- Assuming oversold always means buy.
- Ignoring support and resistance.
- Ignoring volume.
- Changing settings to fit historical results.
- Overfitting.
- Skipping backtesting.
- Trading without a stop.
- Using indicators instead of understanding market structure.
How EGXBot Can Help
- Screen stocks by moving-average structure.
- Measure ADX trend strength.
- Analyze RSI and MACD momentum.
- Compare current volume with average volume.
- Monitor OBV, MFI and CMF.
- Calculate ATR-based risk.
- Track support and resistance.
- Create indicator-based alerts.
Useful AI Assistant Questions
- What is the current trend using MA50 and MA200?
- Does ADX confirm a strong trend?
- Analyze RSI and identify any divergence.
- Does MACD confirm or lag the current move?
- Is this breakout supported by RVOL?
- Do OBV and CMF confirm money flow?
- Calculate ATR and suggest a logical risk distance.
- Which indicators on my chart are redundant?
- Build an indicator score for this stock.
- Is the current market trending or ranging?
- Calculate position size for 0.5% account risk.
Beginner Indicator Setup
- MA50.
- RSI.
- Volume.
- ATR.
Day Trader Setup
- VWAP.
- EMA20.
- RSI.
- RVOL.
- ATR.
Swing Trader Setup
- MA50 / MA200.
- MACD.
- Volume.
- OBV or CMF.
- ATR.
Final Pre-Trade Checklist
- What is the trend?
- Where are support and resistance?
- Does the trend indicator confirm?
- Does momentum support the trade?
- Does volume confirm participation?
- Is there divergence against the position?
- What is current volatility?
- Where is invalidation?
- Where is the stop?
- What is position size?
- What is reward-to-risk?
- Are my indicators independent or redundant?
- Is a major news event approaching?
Conclusion
Mastering technical indicators does not mean memorizing every formula or placing twenty tools on a chart.
It means knowing which tool to use, why you are using it and when its signal should be ignored.
Start with price structure, trend, support and resistance.
Then use:
- A trend indicator.
- A momentum indicator.
- Volume confirmation.
- A volatility or risk tool.
Do not search for a perfect indicator. Build a repeatable process with positive expectancy over a large sample of trades.
Indicators cannot turn a poor setup into a good trade. Price comes first, context comes second, indicators provide confirmation, and risk management decides survival.
This content is educational and does not constitute investment advice. Technical indicators are probabilistic tools and can generate false signals. Appropriate risk management and strategy testing are essential.
Stop Searching for a Magic Indicator — Build a Complete Trading System
Start with price and trend, use momentum for confirmation, validate participation with volume and liquidity, and use ATR and position sizing to define risk before entering.
Use EGXBot to compare indicators, detect divergences, monitor Relative Volume, analyze trend and create alerts that help you wait for structured setups instead of chasing price.
This content is educational and does not constitute investment advice.
Apply it with egxbot
Get real-time analysis, signals and a bilingual AI assistant for Egyptian Exchange stocks — free to start.
Start free on Telegram