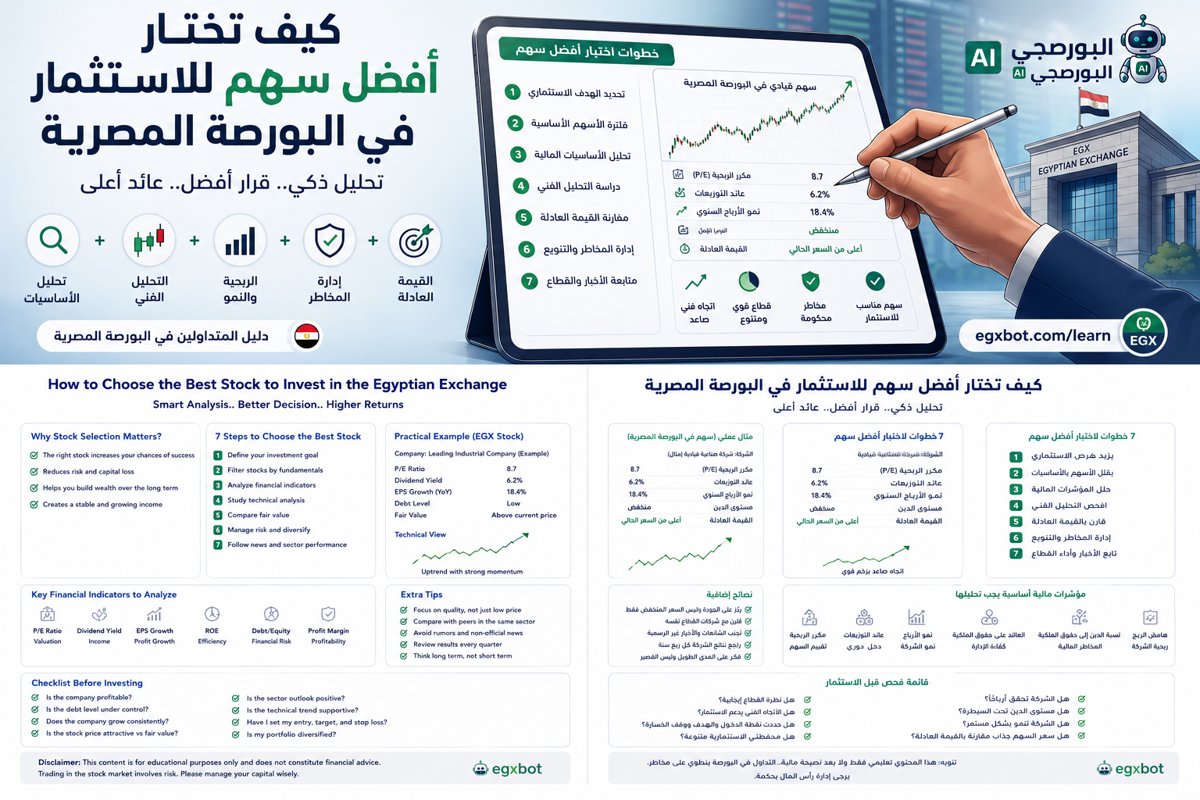
Choose an investment stock by looking for a business you understand, sustainable revenue and profit growth, healthy cash flow, manageable debt, and attractive returns on capital. Then compare the share price with earnings, assets, and expected growth while reviewing governance, liquidity, and risks. A low share price or popular recommendation does not automatically mean good value.
Choosing a stock for long-term investment is different from selecting a short-term trade. An investor is not only looking for an immediate price move but buying an ownership stake in a business expected to grow its earnings and value over time.
That is why there is no single “best stock” for every investor. The strongest candidate is usually the one that combines business quality, a reasonable purchase price, and risks that match the investor’s objectives and time horizon.
A Good Company Is Not Always a Good Stock
An excellent company can trade at such a high valuation that future returns become limited. A low-priced stock can also be cheap for a valid reason, such as deteriorating operations, weak cash flow, or excessive debt.
- Company quality: business strength, growth, profitability, cash flow, management, and financial position.
- Stock attractiveness: whether the current market price is reasonable relative to value, earnings, growth, and risk.
Strong investing begins with the relationship between quality, value, and risk—not with the lowest share price.
Step One: Understand the Business
Do not invest in a company if you cannot explain how it makes money in a simple sentence. Understand what it sells, who its customers are, and which factors can increase or reduce profitability.
- What is the company’s main product or service?
- Is demand stable, cyclical, or seasonal?
- Does the company depend on one customer or supplier?
- Is it sensitive to foreign exchange, interest rates, energy, or imports?
- Does it have a sustainable competitive advantage?
- Is the industry expanding or facing long-term pressure?
Step Two: Review Revenue and Earnings Growth
Sustainable growth is one of the main drivers of long-term business value. One strong year is not enough; investors should understand the source and repeatability of growth.
Review at least three to five years when data is available:
- Revenue growth.
- Gross profit growth.
- Operating profit growth.
- Net income growth.
- Earnings-per-share growth.
A simplified compound annual growth rate formula is:
CAGR = (Ending value ÷ Beginning value)^(1 ÷ Number of years) − 1
Step Three: Assess Earnings Quality
Not all profits are equal. Net income may rise because of an asset sale, foreign-exchange gain, or another non-recurring item without improvement in the core business.
Compare:
- Operating profit with net income.
- Net income with operating cash flow.
- Recurring earnings with exceptional gains.
- Earnings growth with changes in the share count.
If reported profit rises while cash flow remains weak for an extended period, investigate receivables, inventory, and customer collections.
Step Four: Analyze Profit Margins
| Metric | Formula | What It Measures |
|---|---|---|
| Gross margin | Gross profit ÷ Revenue | Pricing power and direct production costs |
| Operating margin | Operating profit ÷ Revenue | Core operating efficiency |
| Net margin | Net income ÷ Revenue | Final profitability after financing, tax, and other expenses |
Compare margins with the company’s own history and direct competitors because normal margin levels differ significantly by industry.
Step Five: Review Debt and Financial Liquidity
Debt is not automatically negative. A company may borrow to finance profitable expansion. The risk appears when financing costs rise or the business cannot generate enough cash to meet its obligations.
- Debt-to-equity: reliance on borrowing relative to shareholder capital.
- Net debt: total borrowings minus cash.
- Interest coverage: operating profit divided by interest expense.
- Current ratio: current assets divided by current liabilities.
Financial companies and industrial companies require different interpretations, so always compare ratios within the appropriate sector.
Step Six: Examine Cash Flow
Cash flow reveals whether accounting profits are being converted into real cash. Investors generally prefer positive and consistent operating cash flow that grows with the business.
A simplified free-cash-flow formula is:
Free cash flow = Operating cash flow − Capital expenditure
Free cash flow can be used to fund expansion, reduce debt, distribute dividends, repurchase shares, or strengthen the balance sheet.
Step Seven: Evaluate Management Efficiency
- Return on equity: net income divided by average shareholder equity.
- Return on assets: net income divided by average assets.
- Return on invested capital: efficiency in using operating capital.
A high ROE can be positive, but it may also be inflated by heavy leverage or a small equity base. It should never be interpreted alone.
Step Eight: Review Governance
Strong financial results are not enough when governance is weak. Examine disclosure quality, related-party transactions, capital increases, board decisions, and dividend policy.
Positive Signs
- Clear and timely disclosures.
- Logical explanations for capital allocation.
- Fair treatment of minority shareholders.
- Stable management with measurable results.
- A consistent expansion and dividend strategy.
Warning Signs
- Repeated disclosure delays.
- Large unexplained related-party transactions.
- Frequent strategic changes.
- Profit growth driven by exceptional items.
- Repeated capital increases without improved returns.
Step Nine: Check Stock Liquidity
A quality company may still be difficult to invest in when its shares trade infrequently. Review average traded value, bid-ask spread, active sessions, and the ability to execute the required position size.
- Sharp movements caused by small orders.
- Difficulty entering or exiting.
- Wide bid-ask spreads.
- Slow exits after negative news.
Step Ten: Value the Stock
Once business quality is established, evaluate the price. No single valuation multiple works for every company. Valuation should be compared with growth, sector economics, history, and risk.
| Metric | Formula | Common Use |
|---|---|---|
| P/E ratio | Share price ÷ Earnings per share | Companies with positive and stable earnings |
| Price-to-book | Market value ÷ Shareholder equity | Banks and asset-intensive businesses |
| EV/EBITDA | Enterprise value ÷ EBITDA | Comparing companies with different financing structures |
| Dividend yield | Dividend per share ÷ Share price | Income-oriented investments |
| Free-cash-flow yield | Free cash flow ÷ Market capitalization | Cash generation relative to market price |
Does a Low P/E Mean the Stock Is Cheap?
Not necessarily. The market may expect earnings to decline, the company may carry significant risks, or current earnings may include exceptional items.
Balance Valuation and Growth
A faster-growing company may deserve a higher multiple than a stagnant business. However, paying any price for growth becomes dangerous when expectations are already extremely optimistic.
- Is the expected growth rate realistic?
- Can the business finance that growth?
- Does the current valuation assume perfect execution?
- What happens if results are weaker than expected?
Use a Fair-Value Range
Fair value should be treated as a range rather than an exact number. Build at least three scenarios:
- Conservative: slower growth and weaker margins.
- Base: reasonable continuation of expected performance.
- Optimistic: stronger growth and improving profitability.
Compare the market price with these scenarios and require an appropriate margin of safety.
Analyze Risk Before Potential Return
- Foreign-exchange exposure.
- Interest-rate risk.
- Raw-material inflation.
- Regulatory and tax changes.
- Customer or supplier concentration.
- New competition or technological disruption.
- Weakening liquidity or rising debt.
- Governance risk.
A Simple Stock-Scoring Framework
| Factor | Suggested Weight | What It Measures |
|---|---|---|
| Business quality and competitive advantage | 15% | Demand durability and market position |
| Revenue and earnings growth | 20% | Growth consistency and quality |
| Profitability and returns on capital | 15% | Operating and capital efficiency |
| Cash flow | 15% | Conversion of earnings into cash |
| Debt and financial strength | 10% | Ability to meet obligations |
| Governance and management | 10% | Decision quality and shareholder protection |
| Valuation and margin of safety | 10% | Attractiveness of the current price |
| Stock liquidity | 5% | Ease of entry and exit |
Simplified Comparison Example
| Criterion | Company A | Company B |
|---|---|---|
| Three-year earnings growth | 18% annually | 5% annually |
| Operating margin | Stable and improving | Declining |
| Net debt | Low | High |
| Operating cash flow | Above net income | Well below net income |
| ROE | 22% | 13% |
| P/E | 14 times | 8 times |
Company B looks cheaper based on P/E, but Company A may be the stronger investment if superior growth, cash flow, and financial strength justify the premium.
The figures in this example are hypothetical and educational. They do not refer to a specific listed company or represent an investment recommendation.
The Role of Technical Analysis
Fundamental analysis helps select the business, while technical analysis can help improve entry timing and position building.
- Long-term trend.
- Support and resistance.
- 50-day and 200-day moving averages.
- Volume during breakouts and pullbacks.
- Consolidation after strong financial results.
Technical analysis should not be used to justify investing in a fundamentally weak company, and fundamental quality should not be used to ignore an excessively high purchase price.
Buy at Once or in Stages?
Staged buying can reduce the risk of relying on one entry point. A plan may include:
- An initial position after completing the analysis.
- A second purchase after results or technical confirmation.
- A third purchase during a reasonable pullback with unchanged fundamentals.
Do not use averaging down to justify adding to a company whose investment thesis has deteriorated.
When Should an Investor Sell?
- The original investment thesis is no longer valid.
- Long-term growth deteriorates.
- Debt rises or cash flow weakens materially.
- Serious governance concerns emerge.
- Valuation becomes difficult to justify.
- A better opportunity exists at a similar risk level.
- Portfolio rebalancing is required.
Common Stock-Selection Mistakes
- Choosing a stock because its nominal price is low: a three-pound stock is not automatically cheaper than a one-hundred-pound stock.
- Chasing recent winners: past performance does not guarantee future returns.
- Following recommendations without research: another trader’s goals may differ from yours.
- Using P/E alone: growth, earnings quality, and risk also matter.
- Ignoring cash flow: accounting profit may not become cash.
- Ignoring debt: higher interest rates can pressure earnings and valuation.
- Concentrating heavily in one stock: even strong companies face unexpected risks.
- Confusing brand recognition with value: a famous business is not automatically a good investment at any price.
Investment Checklist
- Do I understand the business and its profit drivers?
- Are revenue and earnings growing sustainably?
- Are profits supported by cash flow?
- Are margins stable or improving?
- Is debt manageable?
- Does the company earn attractive returns on capital?
- Are management and governance reliable?
- Is stock liquidity suitable?
- Is valuation reasonable relative to growth and sector peers?
- Is there a margin of safety?
- What risks could invalidate the thesis?
- What portfolio weight is appropriate?
- What conditions would cause me to sell?
Frequently Asked Questions
Is the highest-dividend stock always the best investment?
No. A high yield can be attractive, but investors must confirm that distributions are sustainable after funding operations, investment needs, and debt obligations.
Is a low-P/E stock always better?
No. A low multiple may reflect declining expected earnings or higher risk. Compare valuation with growth, earnings quality, sector conditions, and financial strength.
How many years of financial statements should I review?
Three to five years are useful for identifying trends, together with the latest quarterly results and material disclosures.
Should I invest only in EGX30 companies?
EGX30 stocks generally offer stronger liquidity and wider analyst coverage, but opportunities may exist outside the index. Index membership is not a substitute for fundamental analysis.
How many stocks should an investment portfolio contain?
There is no universal number. The portfolio should be diversified enough to reduce single-company risk while remaining small enough to monitor effectively.
Can artificial intelligence select stocks for me?
AI can accelerate data collection, comparison, and pattern detection, but investors should still review financial statements, risks, assumptions, and valuation rather than relying on an automated result alone.
Conclusion
The best investment stock is the result of a structured process, not a permanent company name. Start by understanding the business, then examine growth, earnings quality, cash flow, debt, profitability, governance, and management.
After confirming business quality, compare the share price with earnings, assets, and expected growth. Use a fair-value range, require a margin of safety, and avoid concentrating most of the portfolio in one stock.
Stock investing involves financial risk, and business fundamentals may change. This content is educational and does not constitute a recommendation to buy or sell a specific security.
Compare Egyptian Stocks Before Investing
Use egxbot tools to review stock performance, charts, valuations, and financial indicators, then compare companies based on growth, profitability, risk, and fair value.
This content is educational and does not constitute a direct recommendation to buy or sell. Review official financial statements and disclosures, and invest according to your risk tolerance.
Apply it with egxbot
Get real-time analysis, signals and a bilingual AI assistant for Egyptian Exchange stocks — free to start.
Start free on Telegram